View project details
To enter the detailed view of a project, go to the project search, search for the project you want to check out and click on the result.
General information
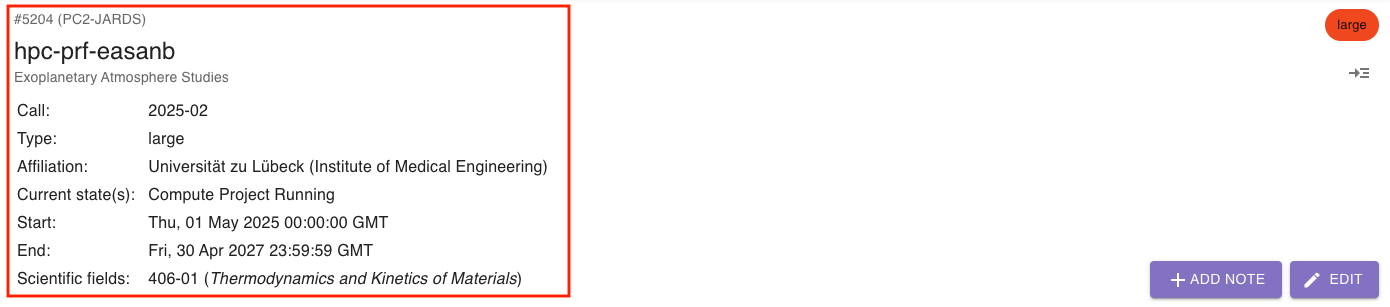
Section titled “General information”On the top left, you will find general information about the project such as the origin, the abbreviation and the title, project type etc.:
On the top right, you will see the (color coded) project type as well as a button:
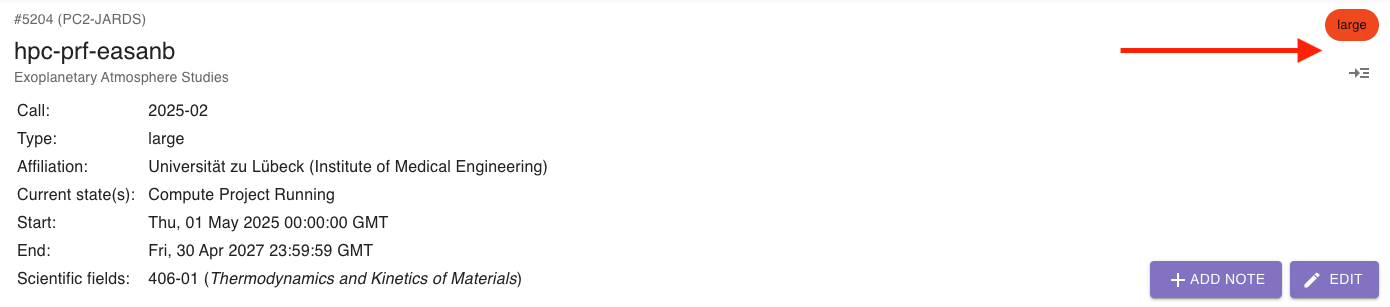
This button opens the “description view”, which contains the project’s description as well as other additional description that has been added programmatically. Please check out the guide on how to add custom data to a project’s description view for further information.
Event queue
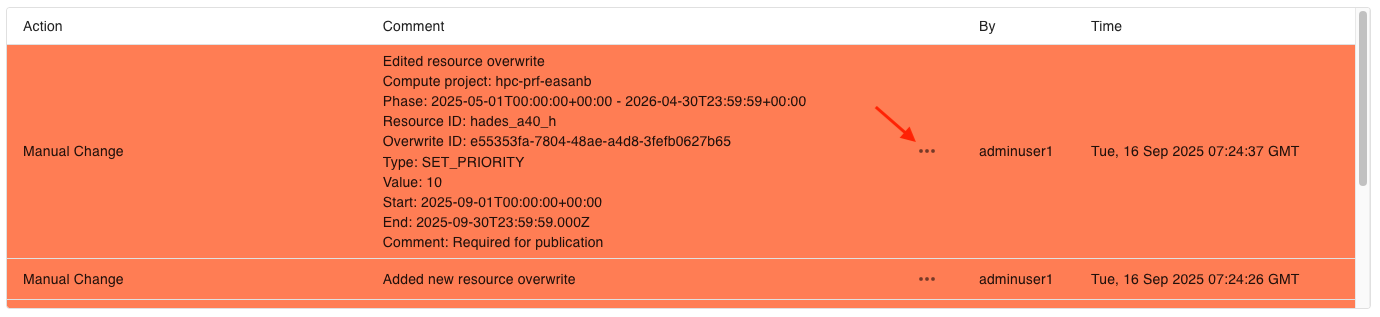
Section titled “Event queue”The event queue shows a project’s activity. It displays all events related to switching states as well as other actions like manual changes or file uploads:
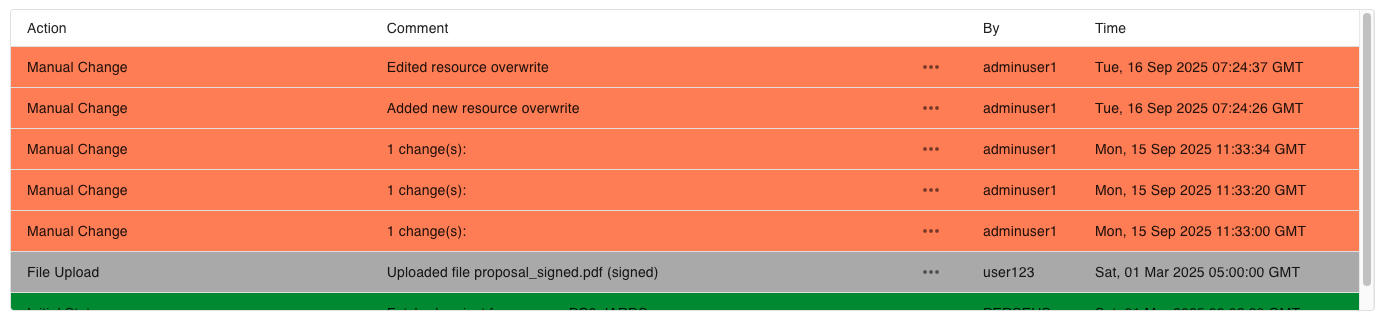
To expand comments which require more than one line, simply click on the three dots on the comment’s right hand side:
Compute projects
Section titled “Compute projects”If there are any, you find all related compute projects below the event queue. Every compute project will have a list of phases based on the granted resources and limits that have been assigned to the compute project. To open a phase, click on the arrow on the right side:
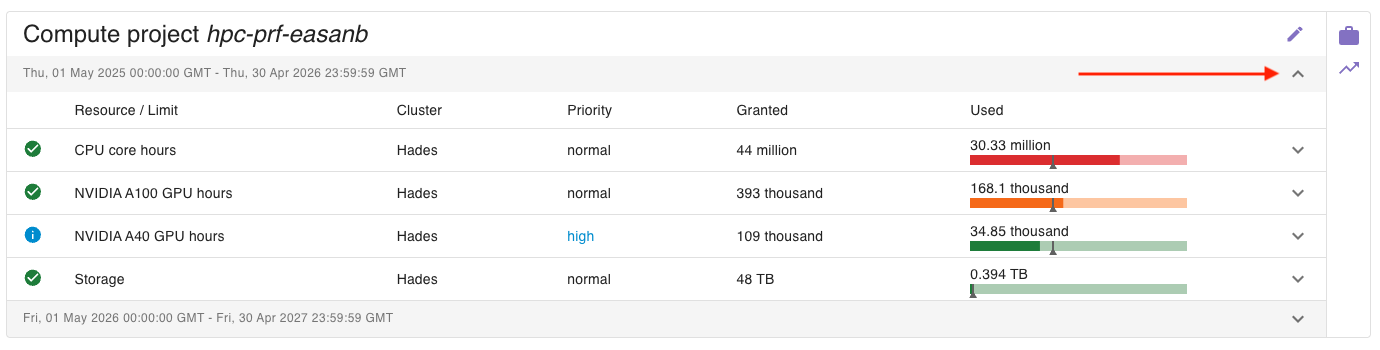
For each phase, you will see all related resources and limits. Each resource entry shows
- an icon indicating if the resource is
- normal (green),
- overwritten (blue),
- blocked (red),
- the name of the resource,
- the name of the corresponding cluster,
- the set priority,
- the current usage as a numeric value and
- the current usage as a bar chart.
Each bar chart show a little grey indicator which has different meanings depending on the type of resource (learn more about resource types):
- cumulative resources: indicates how much of the resource should have been used if it would have been used evenly over the granted period (later referred to as target)
- snapshot resources: indicates the maximum usage value that has been reported
Additionally, each bar chart is color coded:
| cumulative resources | snapshot resources | |
| green | usage <= target | usage < 90% |
| yellow | usage > target | usage >= 90% |
| red | usage > 1.5x target | usage >= 98% |
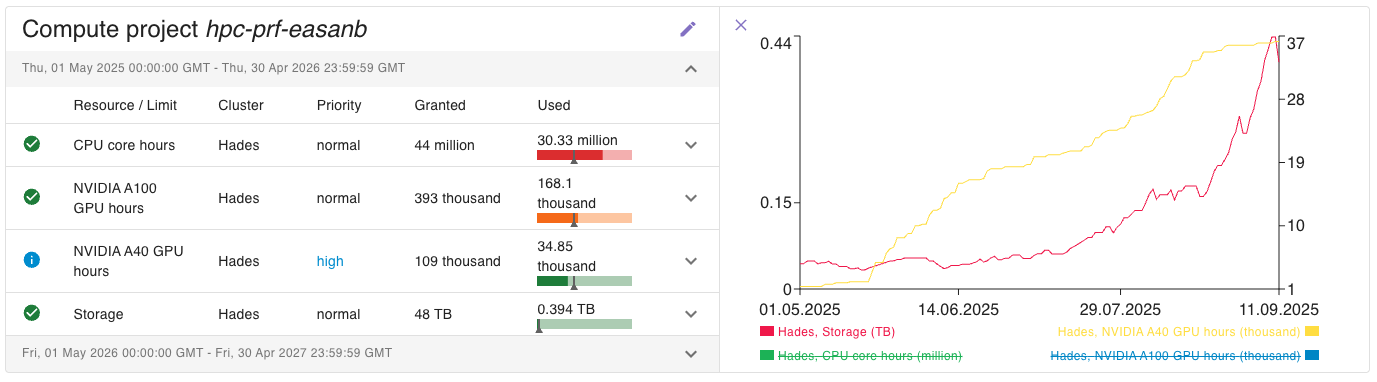
You can also access a graph showing the usage history. To do so, click on the chart icon on the right side of the compute project:
PERSEUS will automatically arrange the resources to a left and a right axis based on the differences in their values. Initially, only the top resources will be shown on both sides. To show or hide resources, simply click on them. The value range of the axis will adapt accordingly.
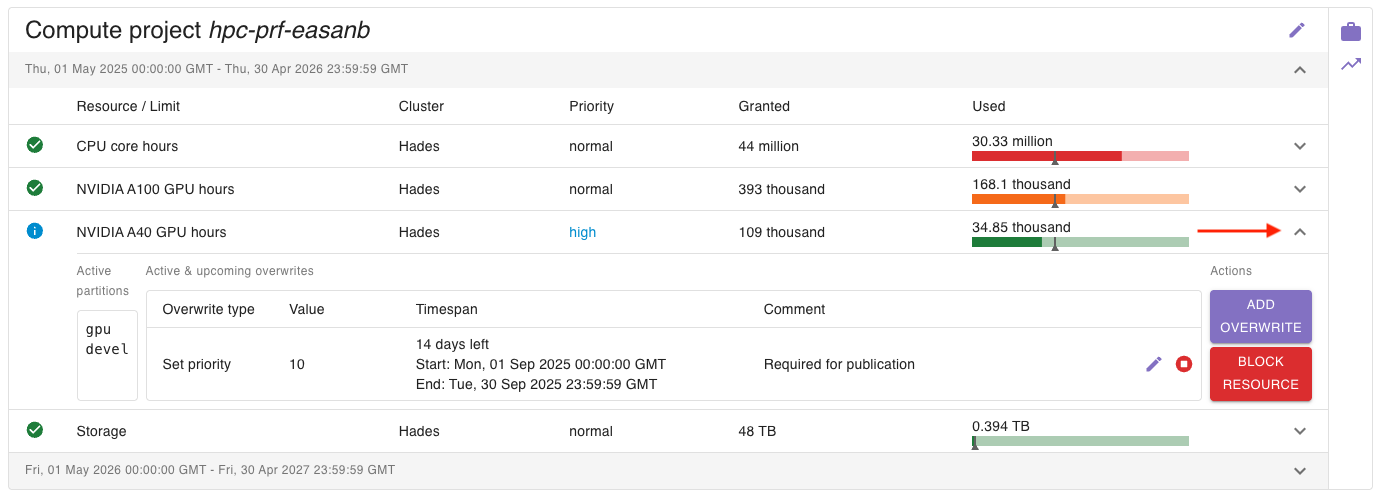
To view the active partitions as well as active and upcoming overwrites, click on the arrow at the right of the corresponding resource entry:
Resources & Limits
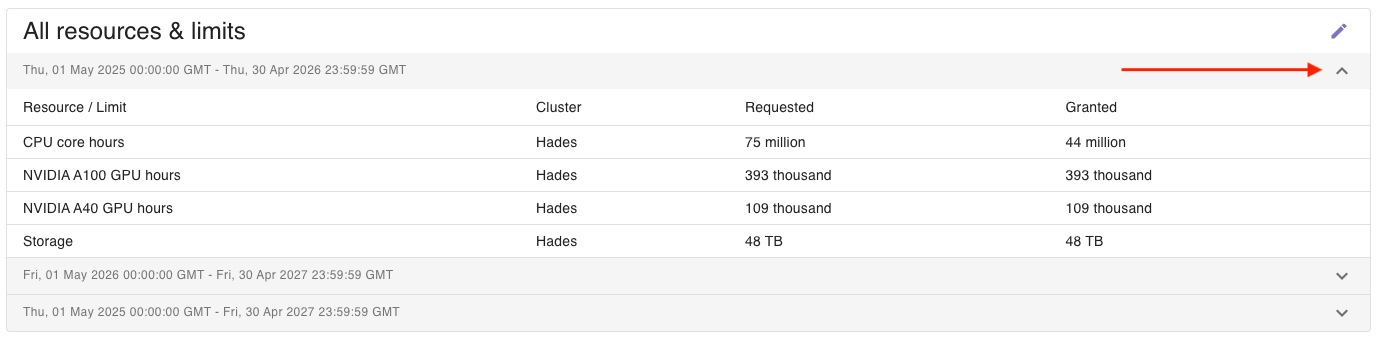
Section titled “Resources & Limits”You find requested and granted resources as well as limits below the project’s compute projects (or below the event queue if there are no compute projects). The resources and limits will be grouped in phases based on the related time periods of both requested and granted items. To open a phase, click on the arrow on the right side:
Responsible persons
Section titled “Responsible persons”To view who are the principal investigator and person of contact, open the “View responsible persons” accordion:
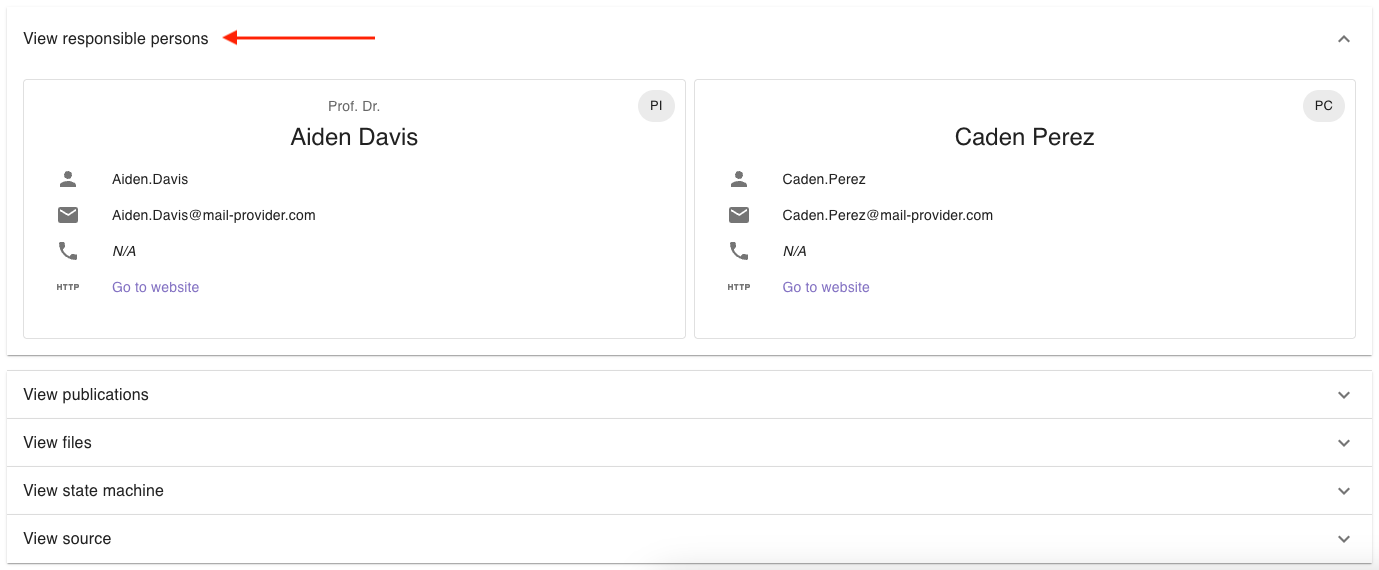
For each person, basic information will be displayed (if available). To enter a person’s details, simply click on the person’s name.
Publications
Section titled “Publications”To view all scientific publications related to a project, open the “View publications” accordion:
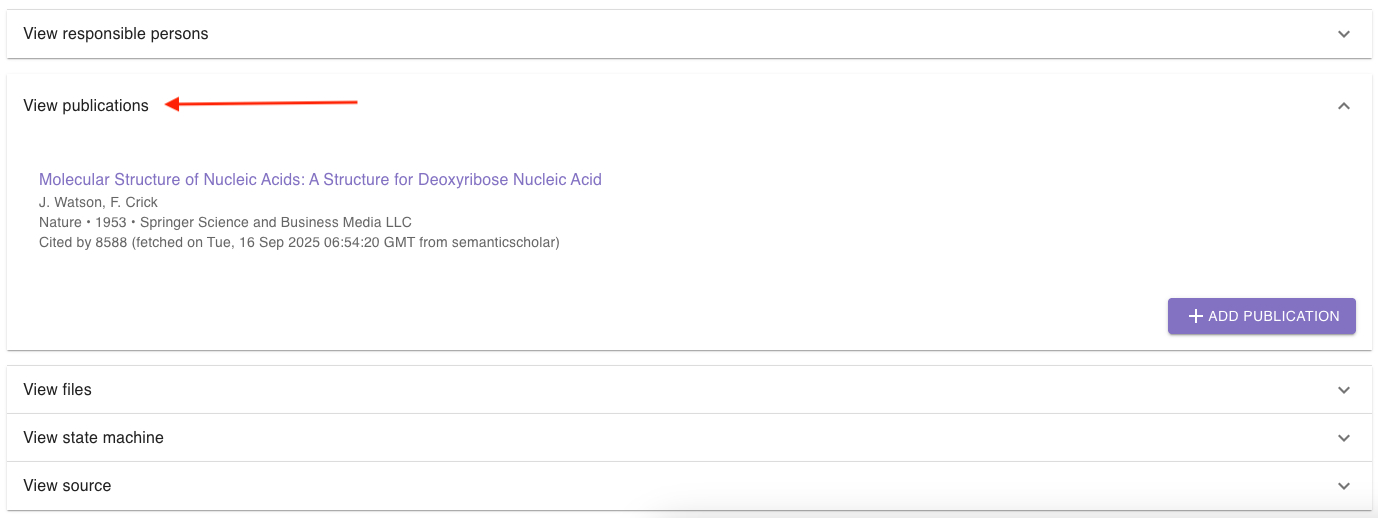
Depending on the type of publication, relevant information will be displayed. If possible, the publication can be accessed by clicking on the title.
To view all files related to a project, open the “View files” accordion:
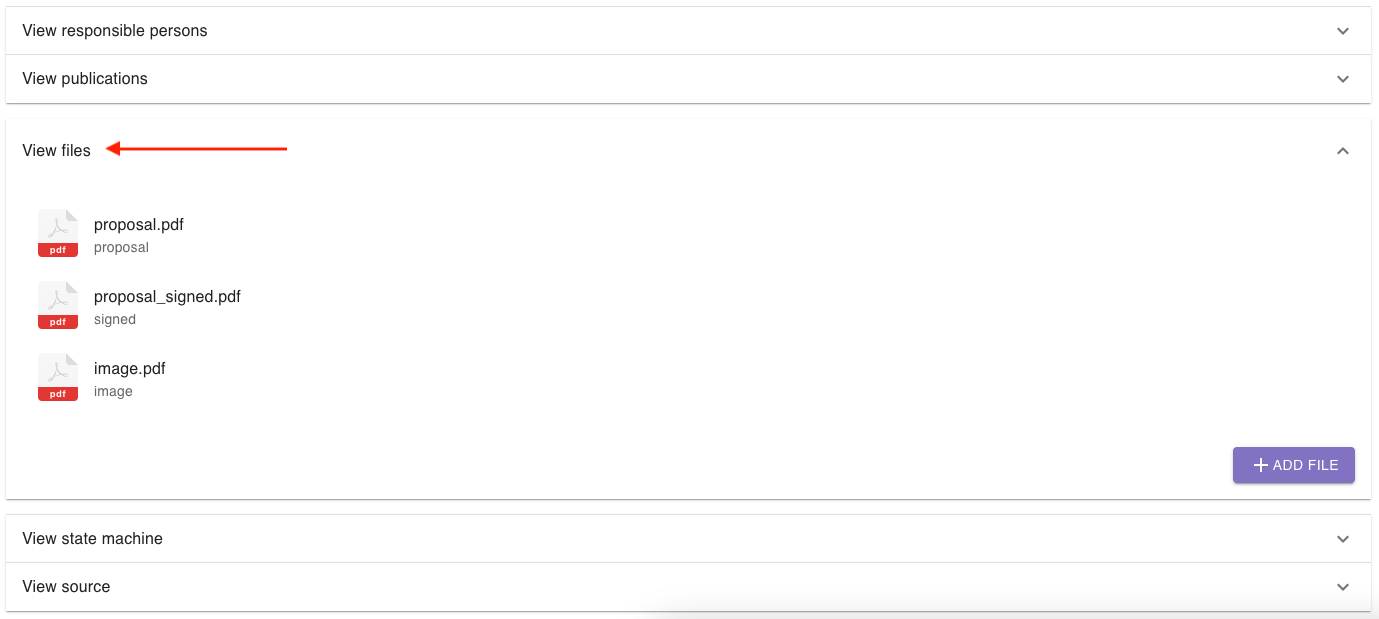
To view a file, simply click on it.
State machine
Section titled “State machine”To view the state machine of a project, open the “View state machine” accordion:
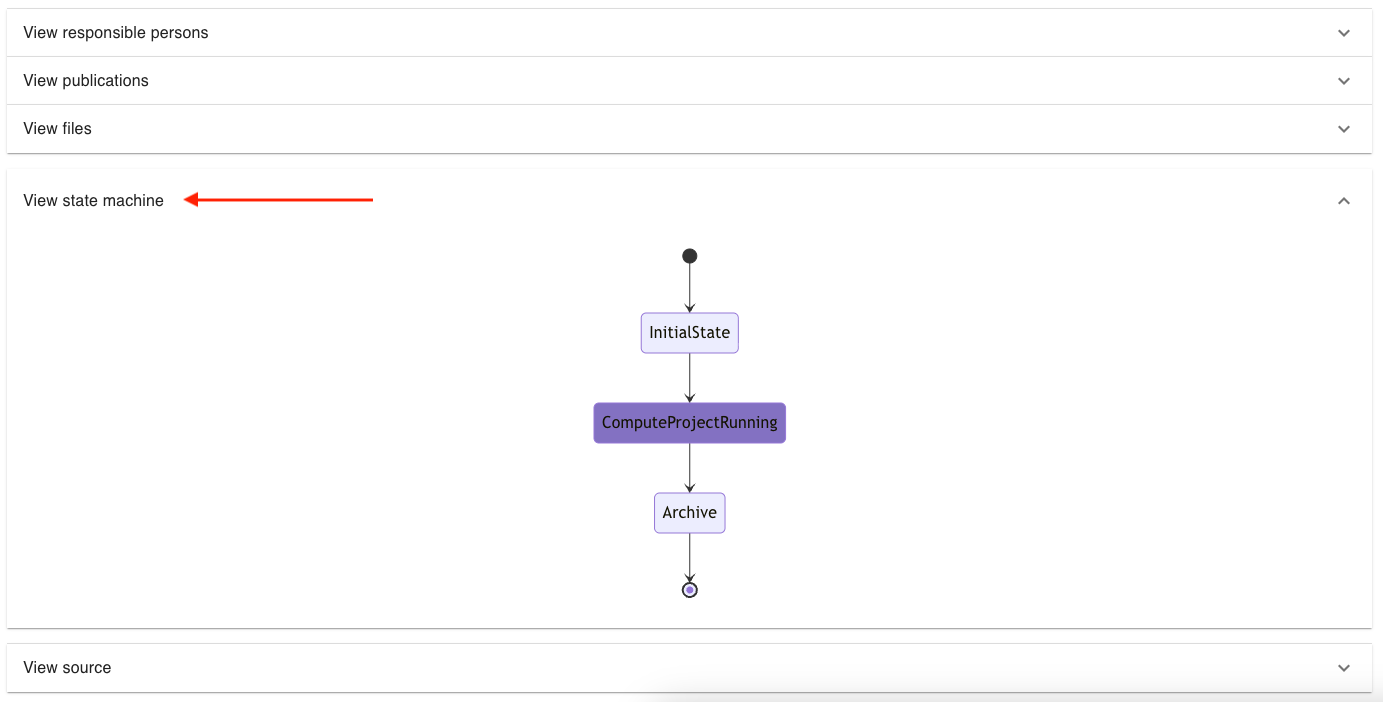
The current state(s) will be highlighted.
Source (advanced)
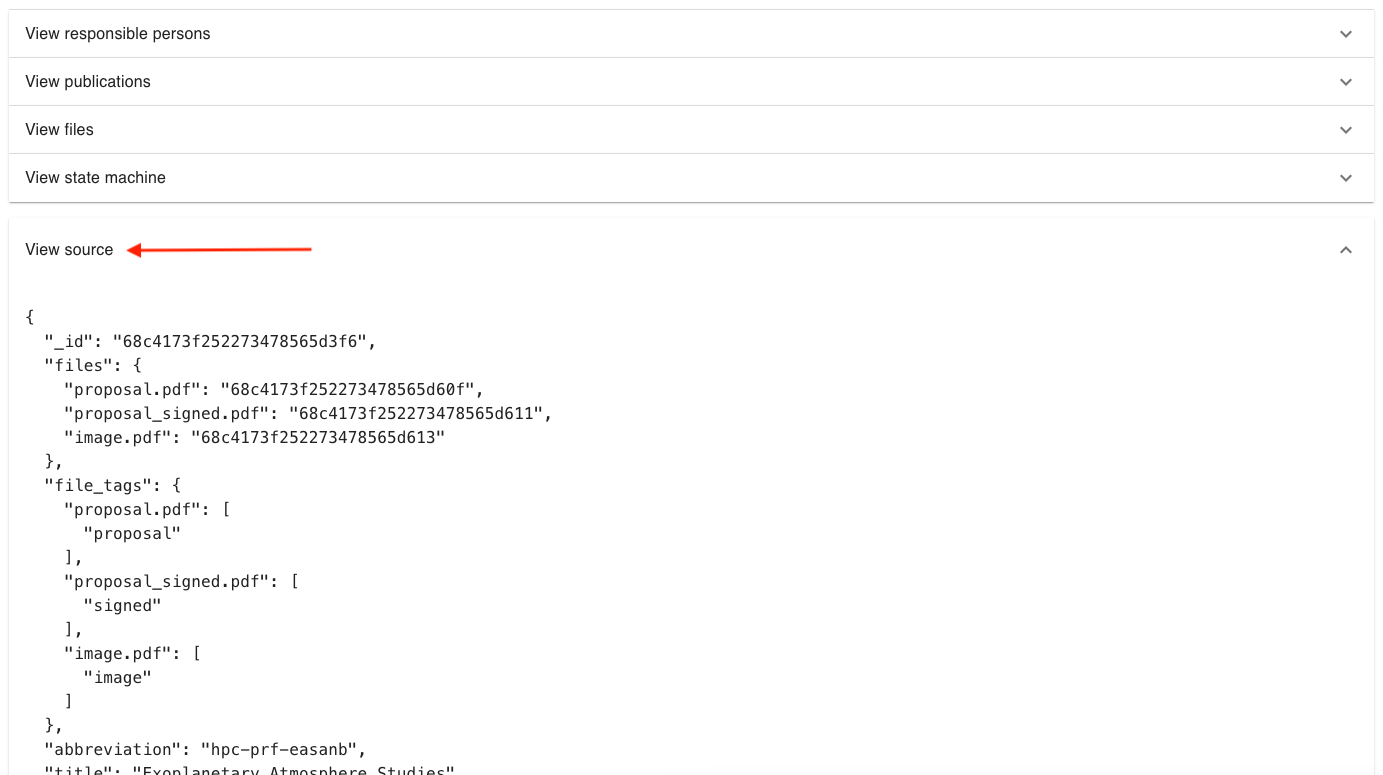
Section titled “Source (advanced)”To access the complete database dump for a project, open the “View source” accordion: